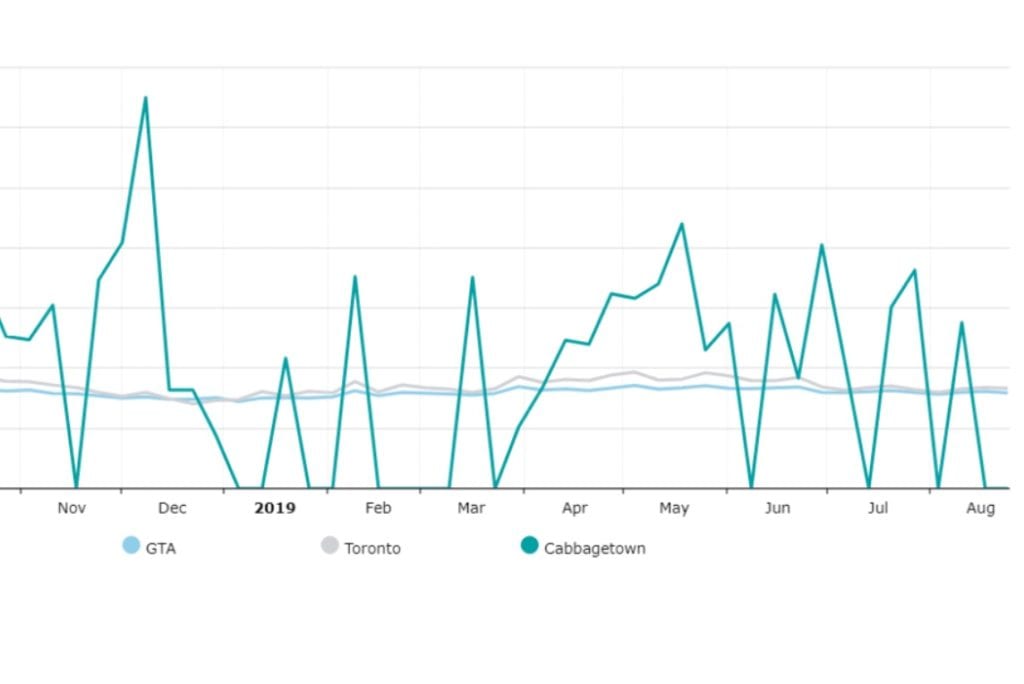
Let’s talk about Toronto real estate appreciation, shall we?
__________________________

Listen to the associated podcast here and keep this page open so you can reference the links below! PODCAST: A CUP OF KARYN: Episode 2: Toronto Real Estate Appreciation Lesson
Skip the intro and go to 1:21 to begin!
__________________________
Toronto real estate appreciation is not to be confused with number of sales. When the news reporters report that local real estate sales are down, this does not mean appreciation is down. It just means there were less sales transactions last month than the previous year before.
The numbers behind Toronto real estate appreciation on the other hand are significantly more valuable – as a buyer, as a seller, and as an investor – because it tells you and I how much more a Toronto property is worth today than it was last year.
Last month, in September 2019, the Toronto Real Estate Board (TREB) reported that the city’s real estate residential sector increased by 5.2 % year over year.
What does that mean?
It means that if we take the average of all types of residential homes – condos, townhouses, detached freeholds, and semi-detached houses – that on average across the GTA, we’re up year over year by 5.2%. Rounding that to 5% hypothetically should mean:
- A 500,000 condo is worth 25,000 more today than last September and
- A 1,000,000 house is worth 50,000 more today than last September.
 Correct?
NO!!! Wrong!
It’s wrong because the average across an entire board is just that. One big fat average. For example, Aurora freehold homes did not appreciate at the same rate that downtown condos did. Nor is condo appreciation the same in Mimico vs St Lawrence Market, or house appreciation in Whitby vs Milton. It’s like comparing apples to tomatoes.
If we look deeper, in September, 2019, this is sampling how different areas across the city per type performed:
- Burlington detached homes — up 14.98% year over year
- Richmond Hill detached homes — down 1.59% year over year
- Leslieville/Riverdale (E01) condos — up 12.9% year over year
- Lawrence Park (C04) detached homes — down 1.01% year over year
- Mount Pleasant East/West townhoomes (C10) – up 0.50% year over year
But the Toronto real estate appreciation calculations don’t stop there! The reality of whatever your investment is has 2 further tiers of analyzation when it comes to determining its year over year value. My newest podcast references 3 valuable links:
- The MLS monthly home price index
- The MLS neighbourhood map **click on “area, municipalities and communities!!!**
- The SAGE real estate monthly neighbourhood reports **not published online, so you must send me your email address if you want to be a recipient of these monthly reports.


Nothing in these links is data that you will find in the media reports you’re watching and reading right now. Why? Because the media doesn’t report specifics. The media reports averages.
Understanding and keeping on top of Toronto real estate appreciation is a great way to know, before you even ask a real estate agent, how the market is performing. What it doesn’t tell you is how your individual property is doing nor what is happening on the front lines at any given month. If you have any questions about what your individual property is worth, or what the one you dream of buying is worth, never hesitate to drop me an email to ask.
